I Read My Agent's Diary
Every agent run leaves a trail. Record it, judge it, find the hotspots, fix them, run again. That's the loop that turns unpredictable agents into reliable ones.
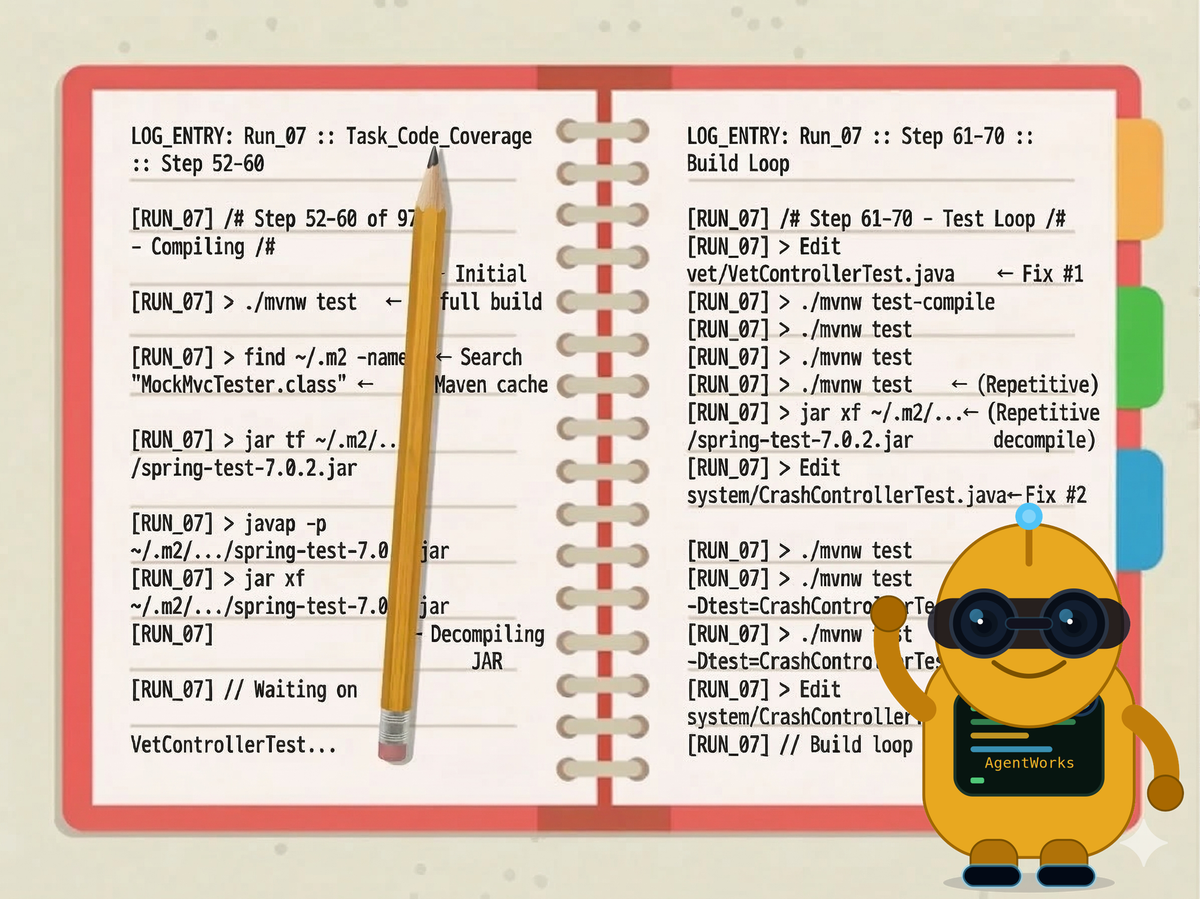
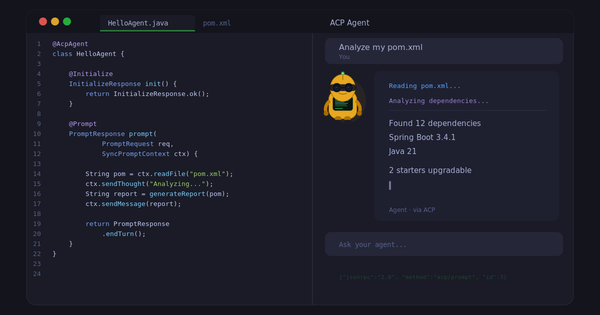
The task was simple: write JUnit tests for Spring PetClinic to improve code coverage. Here is a real excerpt from one of my agent runs — steps 52 through 70 of 97, mid-task. This is what the agent actually did.
./mvnw test                                          ← first full build attempt

find ~/.m2 -name "MockMvcTester.class"               ← searching Maven cache
jar tf ~/.m2/.../spring-test/7.0.2/spring-test-7.0.2.jar
javap -p ~/.m2/.../spring-test-7.0.2.jar
jar xf ~/.m2/.../spring-test-7.0.2.jar              ← extracting the jar

Edit  vet/VetControllerTest.java                     ← fix attempt #1
./mvnw test-compile
./mvnw test
./mvnw test

jar xf ~/.m2/.../spring-test-7.0.2.jar              ← jar inspection again

Edit  system/CrashControllerTest.java                ← fix attempt #2
./mvnw test
./mvnw test
./mvnw test -Dtest=CrashControllerTest
Edit  system/CrashControllerTest.java                ← fix attempt #3
./mvnw test -Dtest="CrashControllerTest"
./mvnw test -Dtest="CrashControllerTest"
./mvnw test -Dtest="CrashControllerTest"             ← build call #11 of 23
This is real. Every line is from the actual execution log.
The agent had done everything right in the first phase — read the knowledge base, explored the codebase, wrote a test plan, then wrote eleven test files. Then it hit a compilation error in VetControllerTest.java, couldn't identify which class from spring-test to use, and started decompiling jars from the local Maven cache to find out. Then it got stuck on CrashControllerTest and ran the build six consecutive times trying to fix the same failing test.
Another run of the exact same task — same model, same codebase, same goal — did it cleanly. No jar inspection at all. Same model, same task, completely different trajectory. The question is: why? And once you can see why, can you fix it?
TL;DR: Every agent run leaves a trail. This post shows how to record that trail, find where agents waste time, and fix it systematically. The method: run experiments, judge results, read the execution log, fix the hotspot, repeat. Most tools cover one slice — building, observing, or evaluating. This is the full cycle. On Spring PetClinic, this cycle cut agent steps by 27% at the same quality. The five levers that work: harden the prompt, add domain knowledge as skills, front-load deterministic analysis, build structured tools, and add runtime steering. All tooling is Java on Maven Central.
From Scripts to Experiments
Since last summer, I've been experimenting with building agents for software development tasks — issue classification, PR merging and review, code coverage.
It started simply. Claude Code's headless mode — claude -p — turns the model into a Unix utility:
git log --oneline -n 10 | claude -p "Create release notes"
A deterministic step feeds data to an AI step — the simplest possible workflow. But what's missing is validation. Did it make good release notes? You don't know until you check. That question — "did the agent actually do a good job?" — turns out to be the hard one. But calling Claude Code programmatically was powerful. Anthropic realized this too — they created the Claude Agent SDK for Python and TypeScript. I built the Claude Agent SDK for Java. Then I extended the idea to call any agentic CLI tool — Claude, Gemini CLI, Amazon Q, Codex, Goose — through a single portable interface: AgentClient.
Now I was interested in whether these agents actually worked, but measurably. I started looking into AI software benchmarks. What I found is that agent benchmarks for Java are basically nonexistent, and those that do exist focus on one specific use case in software development: fixing issues. SWE-bench is the standard — give an agent a GitHub issue and a codebase, see if it can produce a patch that passes the tests. The SWE-bench ecosystem is really tied to Python. When Amazon published SWE-PolyBench — the first multilingual extension — early agents scored around 7% on Java tasks compared to 75% on Python. Even now, the best Java resolve rate on that benchmark is ~35%. That's very far from my experience with these tools on real Java codebases. When I dug into the methodology, they hadn't even set up the JDK correctly. So I started building a benchmark system where an agent could be measured accurately on how well it achieves its goal — whether that's issue fixing, PR review, or any of the many tasks we face as Java developers.
But how do you know if an agent achieved its goal? You need judges. You can't just say "that looks good to me." You wouldn't ship business logic you tested by clicking around the UI and saying "looks fine" — you'd write unit and integration tests with clear assertions that verify behavior. Judges play that role for agents. Some checks are deterministic — did the code compile? Did coverage go up? Others require judgment — is the generated code actually good? That's where LLM-as-judge comes in. Agent Judge provides a system of tiered judges that combine both: hard criteria and soft evaluation, scored against the same rubric every time.
Lastly, I needed a way to run multiple variations of the same task — changing a single thing each time — and recording every step via Agent Journal. That became Agent Experiment. Once an experimental run completes, you can determine how the agent behaved and where there are gaps for improvement. Not quite self-learning, but getting in the neighborhood.
With that background, the following are the results from applying different approaches to give the agent the necessary tools and knowledge to write a full set of tests for PetClinic from scratch.
The Experiment: Spring PetClinic, 7 Variants, 20 Runs
The first experiments (v1) targeted trivial codebases — the Spring Getting Started Guides — with smaller models. Claude Haiku 4.5 hit a 0% pass rate. Qwen3-Coder 30B couldn't complete a single run. Too small a model, even with a simple codebase. But the floor was established fast: there's a model capability threshold below which no amount of knowledge or structure helps.
The rest of the experiment used Claude Sonnet 4.6, and the getting-started guides turned out to be too simple as a dataset — the model already knew everything. PetClinic was the step up — a real Spring Boot application with enough surface area that the agent had to make real decisions. Sonnet had the capability. So the question shifted: not can it work, but how well — and why some runs cost twice as much as others.
The setup: clone the repo, delete all existing tests, give the agent a fresh workspace, and ask it to write JUnit 5 tests from scratch to maximize instruction coverage as measured by JaCoCo. To isolate what actually helps, I ran an ablation study — seven variants, each adding one lever, so you can see exactly what each change buys you:
| Variant | What the agent gets | What changed |
|---|---|---|
simple |
Minimal prompt | Baseline |
hardened |
Structured prompt + stopping condition | +prompt structure |
hardened+kb |
Hardened + flat knowledge base | +knowledge (flat files) |
hardened+skills |
Hardened + SkillsJars | +knowledge (structured skills) |
hardened+pre-analysis |
Hardened + project scan script | +deterministic pre-analysis |
hardened+skills+pre-analysis |
Skills + pre-analysis together | compound: skills + pre-analysis |
hardened+skills+pre-analysis+plan-act |
Two-phase: explore then act | +execution structure (plan/act split) |
20 sessions total, 3 runs per variant (2 for simple).
Each run goes through three judges. Two are deterministic: did the tests compile, and what instruction coverage did JaCoCo report? The third is an LLM judge — it scores the generated tests against a rubric: are assertions meaningful, are edge cases covered, does the structure follow Spring testing conventions? Score runs 0–1. The deterministic and quality scores are kept separate — efficiency and quality are independent axes.
What the Agent Spends Its Time On
Agent Journal captures two layers for every run. Tool calls — every Read, Bash, Write, Edit the agent executes. And thinking blocks — the chain-of-thought reasoning the model writes out before choosing each action. Tool calls are what the agent did. Thinking blocks are what it reasoned about before doing it.
I classified 533 thinking blocks across all 20 runs by keyword matching into topics: what was the agent reasoning about before each action?
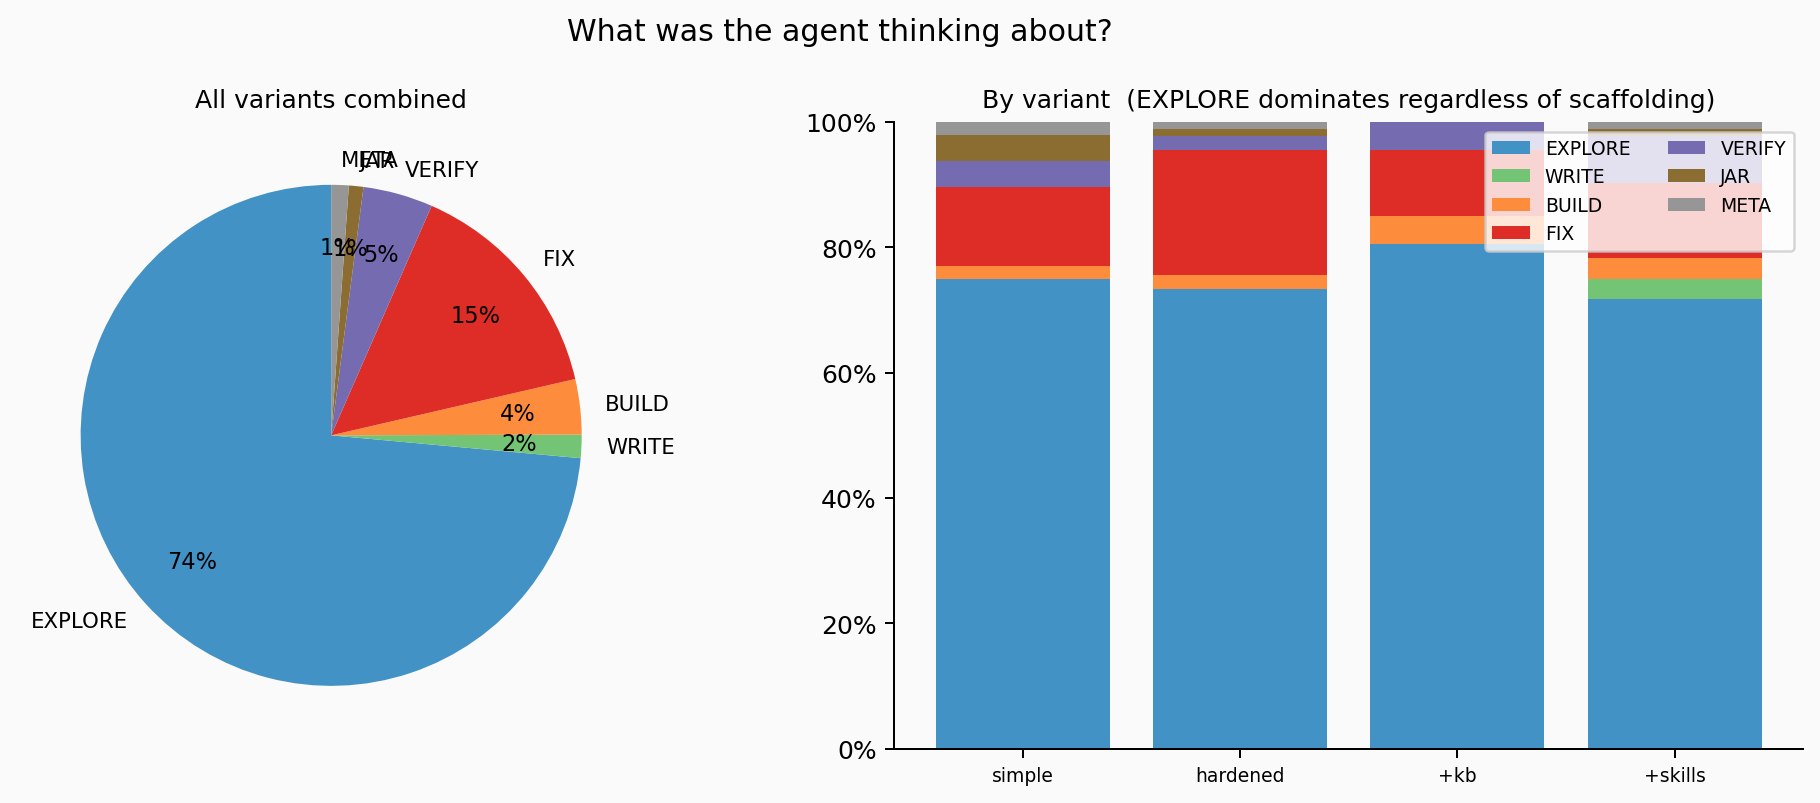
Left: overall distribution — EXPLORE owns 73% of all thinking blocks. Right: per-variant breakdown. The EXPLORE share barely moves regardless of how much scaffolding the agent has.
73% of all reasoning is orientation. Across every variant, across every run. The agent spends almost all of its internal reasoning time figuring out where it is and what to do next. Not writing. Not fixing. Orienting.
But the thinking layer and the action layer tell different stories. The thinking share is stable at ~73% EXPLORE regardless of variant. What changes is what the agent does when it thinks that way. Most EXPLORE actions are Read calls — reading pom.xml, OwnerController.java, BaseEntity.java. That's productive orientation: the agent should read source files before writing tests. The wasteful kind is SHELL — blind find commands searching the filesystem and the Maven cache — and JAR_INSPECT — decompiling jars to discover which artifact provides @SpringBootTest. That's the agent searching because it doesn't have the knowledge to look directly.
Compare hardened to hardened+skills: EXPLORE thinking is ~73% in both. But targeted Read calls jump from 89 to 173, while SHELL commands drop from 62 to 35 and JAR_INSPECT plummets from 54 to 5. Skills don't reduce how much the agent reasons about orienting — they change what it does when orienting. Across every variant we tested, the thinking share barely moved. What changed is the quality of the actions that follow. Whether this holds across different models and tasks is one of the things we'll test next.
The Hotspots: Where the Agent Gets Stuck
The diary log at the top of this post tells a story the data confirms. Because Agent Journal records every tool call, you can classify each one into a behavioral state — EXPLORE, WRITE, BUILD, FIX, VERIFY, JAR_INSPECT — and count how often the agent transitions between them.
Building the heatmap is straightforward. First, classify each tool call into a semantic state — a single Bash call might be BUILD (running ./mvnw test), JAR_INSPECT (running jar tf), or SHELL (running find), depending on the command. Then walk the sequence and tally consecutive pairs: current state on one axis, next state on the other, add a tick mark in the grid. After processing all transitions, normalize each row so it sums to 1.0. The result is a transition probability matrix: each cell tells you how likely the agent is to move from state X to state Y.
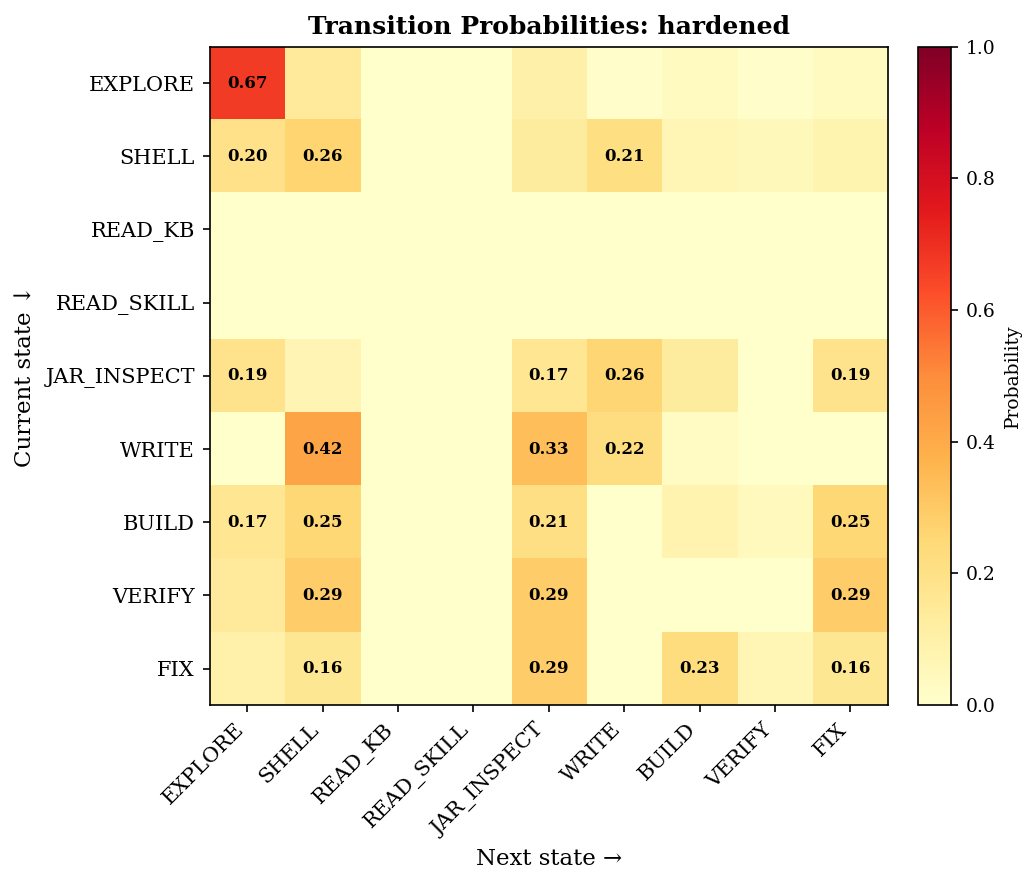
The hardened variant's transition heatmap. Each cell is the probability of moving from state X (row) to state Y (column). Darker = more frequent. Each row sums to 1.0.
Look at the JAR_INSPECT row. The agent retreats to EXPLORE 19% of the time, self-loops back into JAR_INSPECT 17%, moves to WRITE 26%, to FIX 19%, and to BUILD 13%. The retreat to EXPLORE leads straight back — EXPLORE→JAR_INSPECT has a 10% probability, creating a cycle. The state diagram makes the loop visible:
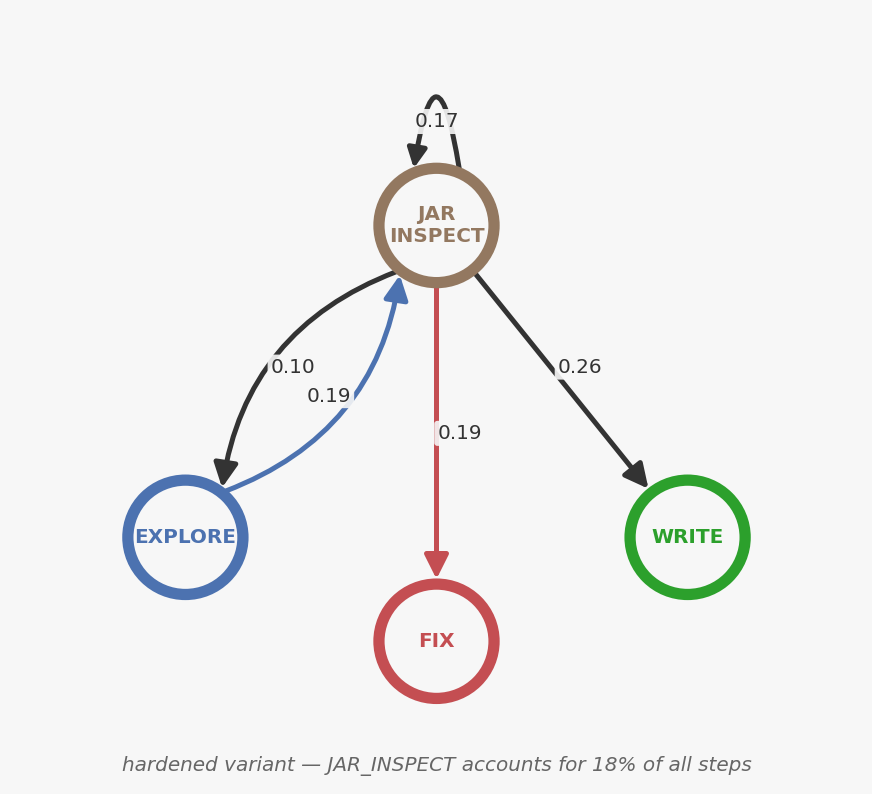
The agent doesn't know which Maven artifact provides @SpringBootTest. There's no source file to check. So it does the developer's last resort: decompile jars from the local Maven cache until it finds the import it needs. Not a capability problem. A knowledge gap.
The transition graph is effectively a probabilistic model of the agent's behavior. Once you have that, a whole toolbox opens up: you can estimate how long the agent tends to linger in these hotspots, how many steps it burns before making progress, and even model how changes to the system will shift that behavior. What starts as a visual pattern becomes a number you can optimize. Full analysis at lab.pollack.ai.
Now give the agent that knowledge — packaged as a SkillsJar:
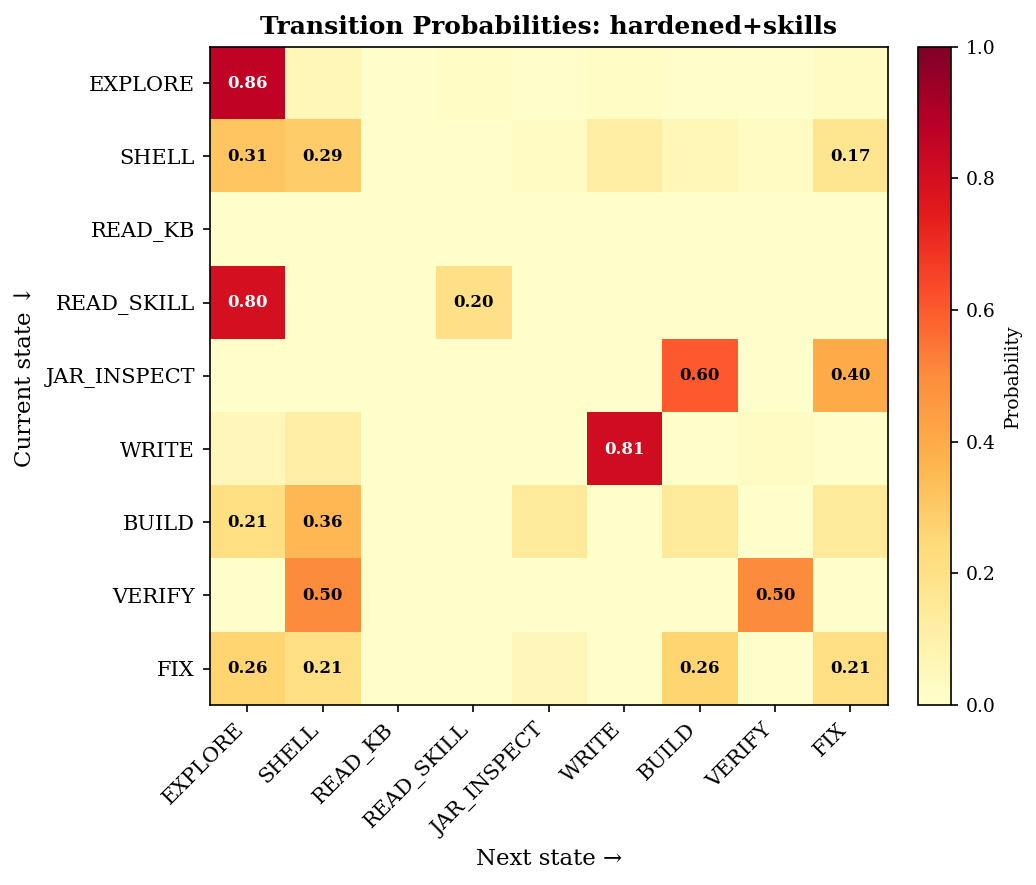
The hardened+skills variant. Same heatmap, same layout. The JAR_INSPECT row is nearly empty — the agent rarely enters that state at all.
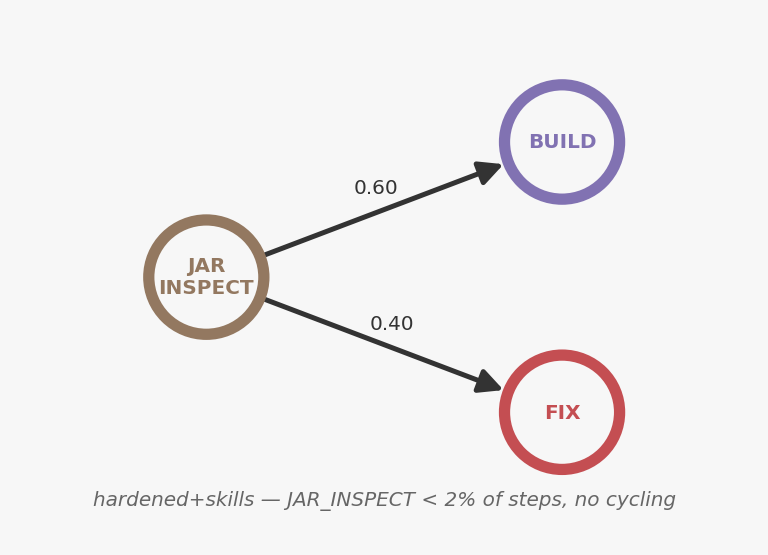
When the agent does reach JAR_INSPECT, it exits cleanly — straight to BUILD or FIX, no cycling. But the bigger change is how rarely it gets there at all. JAR_INSPECT drops from 18% of all steps to under 2%. The knowledge package answered the import question before the agent ever needed to search.
JAR_INSPECT: 18% → under 2%. Combined with pre-analysis, steps drop from 103 to 75 — a 27% reduction at the same quality.
The skills package is
spring-testing-skills(Maven Central) — add it to your Maven project and extract to~/.claude/skills.
A natural question: if steps dropped 27%, why didn't cost drop 27% too? Because the agent still spends comparable time exploring the codebase — reading source files, understanding the domain. That exploration is productive; it's what makes the tests good. What changed is that the exploration no longer detours into unproductive searching. The agent reads OwnerController.java instead of decompiling spring-test-7.0.2.jar. Same attention budget, better allocation.
There's a paradox worth noting: adding a structured prompt increased JAR inspection from 9% to 18%. The hardened prompt made the agent more thorough about finding correct imports — without giving it the answer. Thoroughness without direction equals maximum searching.
What the Data Actually Shows
Quality is scored by a separate LLM judge (T3 — not the same process that wrote the tests) on a 0–1 rubric across 6 criteria: test slice selection, assertion quality, error coverage, domain patterns, coverage target selection, and version-aware patterns. Coverage is JaCoCo instruction coverage — deterministic, measured after each run. All variants landed in the 92–94% range (the model already knows PetClinic).
| Variant | Avg steps (±std) | Avg cost | Quality T3 (±std) |
|---|---|---|---|
hardened+skills+pre-analysis |
75 ± 9 | $3.39 | 0.85 ± 0.02 |
hardened+pre-analysis |
80 ± 12 | $3.41 | 0.79 ± 0.04 |
hardened+kb |
83 ± 7 | $3.21 | 0.85 ± 0.03 |
hardened+skills+pre-analysis+plan-act |
95 ± 11 | $5.11 | 0.88 ± 0.09 |
hardened+skills |
102 ± 10 | $3.70 | 0.86 ± 0.03 |
hardened |
103 ± 18 | $4.08 | 0.85 ± 0.02 |
simple |
110 ± 13 | $3.47 | 0.78 ± 0.07 |
On PetClinic — a codebase the model already knows — every hardened variant converges to roughly the same quality (~0.85) regardless of how you deliver knowledge. The differences are in efficiency, not outcome. The model already knows how to write good PetClinic tests. What varies is how much time it wastes getting there.
Structure first. The biggest single quality jump is simple → hardened: +0.07. No external knowledge — just a stopping condition and a structured output format. Structure first, knowledge second.
Then add skills. hardened+skills+pre-analysis is the most efficient variant: 75 steps, $3.39, same 0.85 quality. JAR_INSPECT drops from 18% to under 2%. Unstructured searching drops from 38% to 13%. The agent writes the same tests — it just wastes 28 fewer steps getting there.
The partial knowledge paradox. Pre-analysis is a fully deterministic step — zero LLM cost — that scans the project and produces a structured analysis before the agent starts. But pre-analysis alone regresses quality — from 0.85 to 0.79. The per-criterion judge breakdown shows where: domain-specific test patterns drop from 0.70 to 0.60, version-aware patterns from 1.00 to 0.87, and edge case coverage from 0.83 to 0.77. The structured plan makes the agent more efficient, but the plan itself doesn't include patterns the agent would have discovered through unconstrained exploration. You need skills to make structured execution work — they give the plan the right vocabulary to scope with. Skills + pre-analysis together recover quality AND cut steps by 31%. Partial structure without the right knowledge produces shallower results than no structure at all.
This pattern — deterministic steps interleaved with AI steps — is what Stripe calls "blueprints" in their Minions system. They're shipping 1,300 PRs a week with it. The pre-analysis variant in this experiment is the same idea: a zero-cost deterministic step that makes the AI step more efficient. Agent Workflow makes that pattern composable in Java.
Plan-act is high ceiling, high risk. Highest mean quality (0.88), widest spread. Best run: T3 = 0.97, the dataset maximum. Worst run: 23 builds, $5.67, a six-cycle FIX→BUILD spiral that produced no better tests. The two-phase design amplifies both success and failure.
All 7 variants hit 92–94% instruction coverage regardless. PetClinic is in the training data — the model already knows it. On a codebase the model knows, structure and knowledge reduce friction but can't change the ceiling. What matters is what happens on a codebase the model doesn't know. That's the next experiment.
Full per-run breakdowns, all heatmaps, and Markov analysis: Code Coverage v2 experiment →
Growing the Agent
This is how you improve an agent: run it, judge it, read the diary, fix the hotspot, run it again. Each cycle is tighter. Most agent tooling stops at observability — you can see what happened. The difference is closing the loop: diagnosing why, applying a specific fix, and verifying the fix worked with the same judges.
The JAR_INSPECT cluster was the first hotspot I fixed. The heatmap showed the loop. The thinking blocks confirmed the cause — EXPLORE thinking without the knowledge to resolve the question. The fix was a 10-line skills entry with the right imports. One dependency, no prompt changes, 25% fewer steps.
That cycle — observe, diagnose, intervene, verify — is repeatable. Once you see a hotspot, you have levers to pull:
- Harden the prompt — the single biggest quality driver in this experiment, and it costs nothing.
- Add skills — package domain knowledge so the agent doesn't have to search for it. This eliminated JAR_INSPECT and cut steps 25%.
- Add deterministic pre-analysis — front-load orientation so the agent spends less time exploring. But pair it with skills to avoid the quality regression.
- Build deterministic tools — replace reasoning loops with tools that return structured answers.
- Add steering hooks — runtime constraints that enforce behavioral rules when they're enumerable.
The next hotspot is already visible in the data: the FIX→BUILD spiral. Run 14 hit 23 builds — six consecutive fix-rebuild cycles on the same test. The agent runs ./mvnw test, reads raw Maven output, tries to interpret the failure, patches the code, rebuilds, and repeats. Lever 4 applies here: a deterministic tool that runs the build and returns structured coverage deltas would collapse that loop — the agent gets actionable feedback ("CrashControllerTest: expected 85%, got 72%, missing branches: lines 34, 41") instead of parsing Maven logs. Same pattern as JAR_INSPECT: replace an unstructured search with a tool that answers the question directly. That's the plan for the next experiment on Apache Fineract.
You wouldn't write application code and then "vibe test" it. You write tests with clear assertions. Agents need the same discipline. Deterministic judges check hard criteria — did it compile, what's the coverage. LLM judges evaluate softer criteria — are the assertions meaningful, does the structure follow conventions. Together they score every run against the same rubric. When your judges pass consistently, your agent is ready for the field.
From Experiment to Benchmark
The judges, dataset, and scoring rubric from this experiment are being promoted into Agent Bench — an open benchmark for Java AI agents. The PetClinic code-coverage task becomes the first benchmark: a defined codebase, a defined goal, deterministic + LLM scoring, and a published baseline.
One thing I've noticed in the agent space is that it's hard to compare approaches. Benchmarks give us a shared vocabulary — same task, same judges, same scoring. You can try a different model, a different framework, a different prompting strategy, and get a result that's directly comparable. The baseline from this experiment — 75 steps, $3.39, 0.85 quality — is a starting point, not a finish line. I'd like to see what other approaches produce on the same task.
There's also a practical reason to invest in measurement infrastructure even if you never switch vendors: AI models get deprecated. The model you're using today will likely be replaced within 6 to 12 months. When that happens, you need to know whether the new model is better, worse, or different for your tasks — not the vendor's benchmarks, but your actual workloads. If you have judges and baselines already in place, a model upgrade is a one-line change followed by a re-run. Without them, it's a leap of faith.
What's Next
PetClinic is in every model's training data. All 7 variants hit 92–94% coverage. Knowledge improved efficiency but couldn't change the outcome. The real test is a codebase the model hasn't memorized.
The next experiment is Apache Fineract — a production banking platform with real loan lifecycle domain rules. The setup changes too: improving an existing test suite rather than writing from scratch. The question gets harder: does domain knowledge change what the agent can produce on an unfamiliar codebase, not just how efficiently it works? And with the experiment infrastructure in place, we can run the same variants across different models — not just Sonnet — to see how much of the behavioral structure is model-specific versus universal.
All of the tools used in this experiment — Agent Client, Agent Journal, Agent Judge, Agent Experiment, and more — are available on Maven Central as part of AgentWorks, a collection of Java libraries for building, evaluating, and understanding AI agents.
Full experimental data — 20 sessions, curated parquet tables, and analysis scripts — is available as a GitHub release with reproducibility instructions. You can regenerate every figure and table in this post from the parquet files without an API key.
Upcoming posts will walk through building your own agent experiments step by step — from defining judges and datasets to running your first variant comparison. If you want to get started now, the getting started guide covers the basics.
The Bottom Line
If you're leading a team that's adopting AI coding agents — or evaluating whether to — here's what this experiment showed:
- Agent behavior is variable. Same model, same task, different trajectory every time. If you're not measuring, you're guessing.
- Structure before knowledge. The single biggest quality jump came from a better prompt — no tools, no knowledge, zero cost. Start there.
- Knowledge eliminates waste, not ignorance. On a codebase the model already knows, skills and knowledge cut steps 27% without changing quality. On an unfamiliar codebase, the impact should be larger — that's the next experiment.
- Partial knowledge can regress quality. Structure without the right vocabulary makes agents shallower. Pair deterministic pre-analysis with domain skills, or skip it.
- Models get deprecated. The model you're using today will be replaced within 6–12 months. If you have judges and baselines in place, a model swap is a re-run. Without them, it's a leap of faith.
The five levers, in order: harden the prompt, add skills, front-load deterministic analysis, build structured tools, add runtime steering. Each one is independently testable. The cycle — run, judge, diagnose, fix, verify — is how you close the loop. Most tools give you pieces of this. The value is in the complete cycle.
All tooling is Java on Maven Central: AgentWorks →
This research is the basis for my workshop at Spring I/O Barcelona. Subscribe to get the workshop materials as soon as they're available.